What happens when you add data to creativity in video marketing for ticketing agencies?
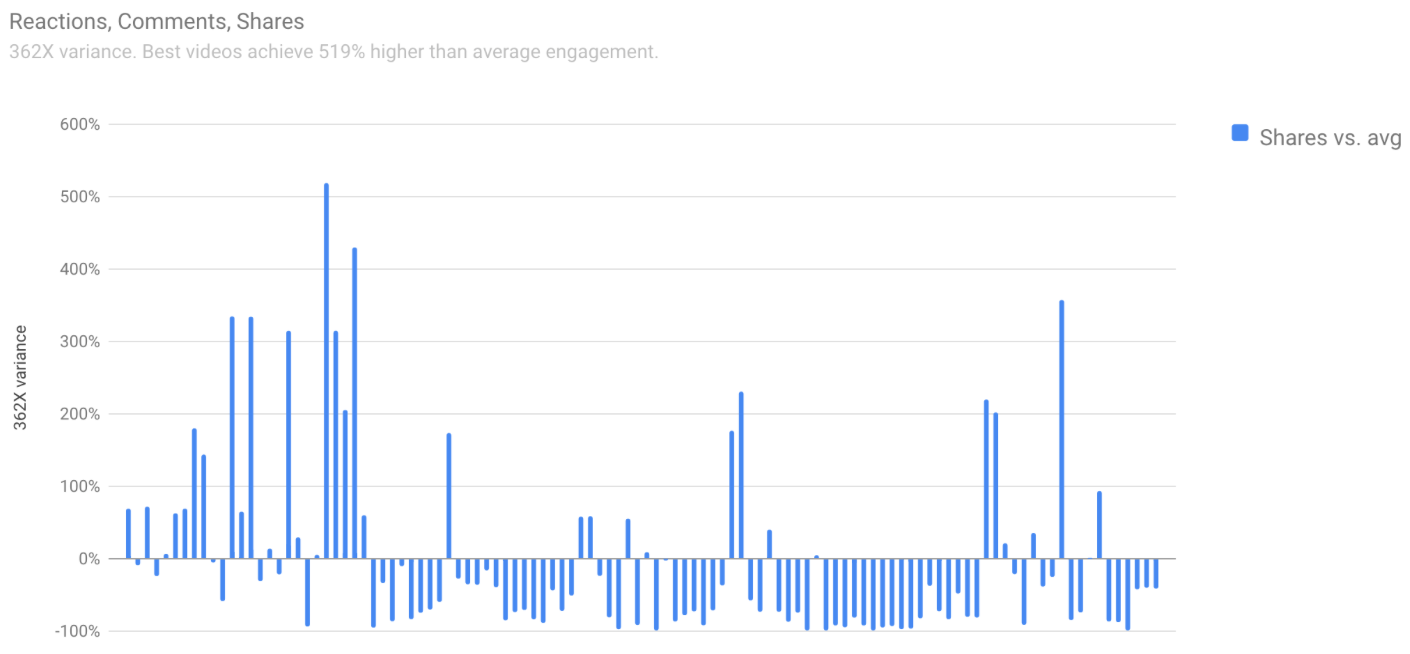
What we found was pretty amazing. There is a massive 362x variation in engagement and ROI, as measured by % shares between the worst videos and the best videos.
This graph below shows shares as a percentage of views for all the different videos, represented by a different bar. The baseline is the average, so if the bar goes above the line, the video did better than average, if it’s below the line the video did worse than the average.
Discover how we replace guesswork with data science to make social video marketing more effective >>
The 36,200% difference between the worst video and the best is most likely caused by a variety of factors including the actual film, it’s brand, name, promotion, etc. But it is also caused by the actual make-up of the video including its color, style, elements, speed, sequence, etc.
To understand these factors, we use computer vision to watch every pixel of every frame to understand exactly what is going on.
The video below shows the computer vision watching the video (yes, how meta is that, a video of a computer watching a video…)
Details of how we do this are here.
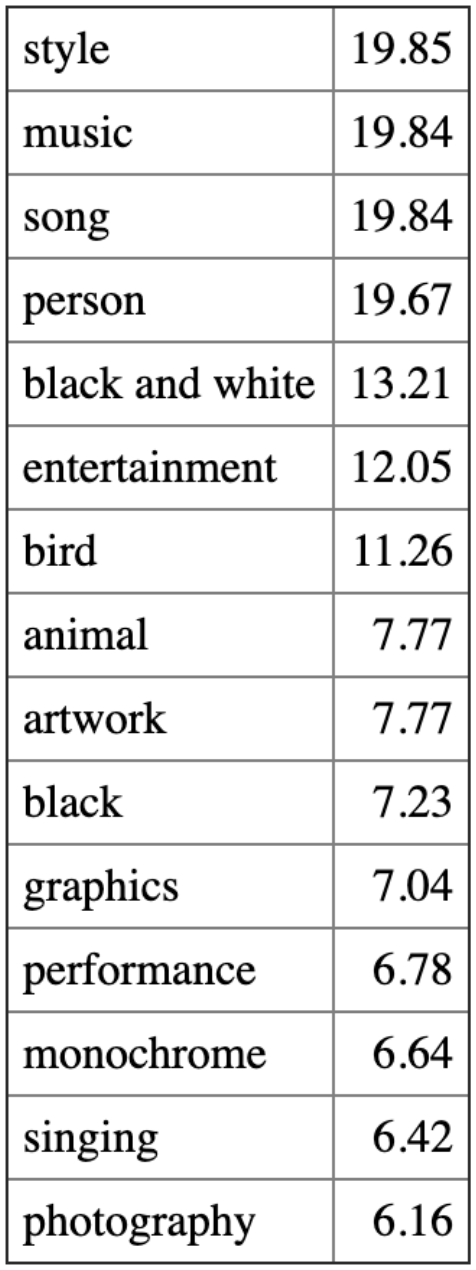
Based on the computer vision analysis of the 100 ticketing agency videos, we have listed the characteristics of those videos which contribute most to a high share-to-view ratio on Facebook.
Creating a Predictive Model from Historical Training Data
Playable uses this data to develop different models for what elements contribute to what outcomes.
These are the different outcomes you could focus on:
- Views – how many people see the video (though obviously paid videos impacts that)
- View time – how long people watch the videos
- Comments – how many people posted comments
- Shares – how many people share it onto others
- Engagement – how many people interact with it
- Sales – how many people convert to a sale – this one requires 1st party data
Discover how Playable uses AI to drive social media video marketing effectiveness >>