100 sneaker videos – from Adidas, Reebok, ASICS, Puma and Converse – were analyzed by Playable using computer vision to detect the objects, events, faces, and sentiments within the videos, in conjunction with video engagement data (number of shares, likes and comments) that is publicly available on Facebook and YouTube.
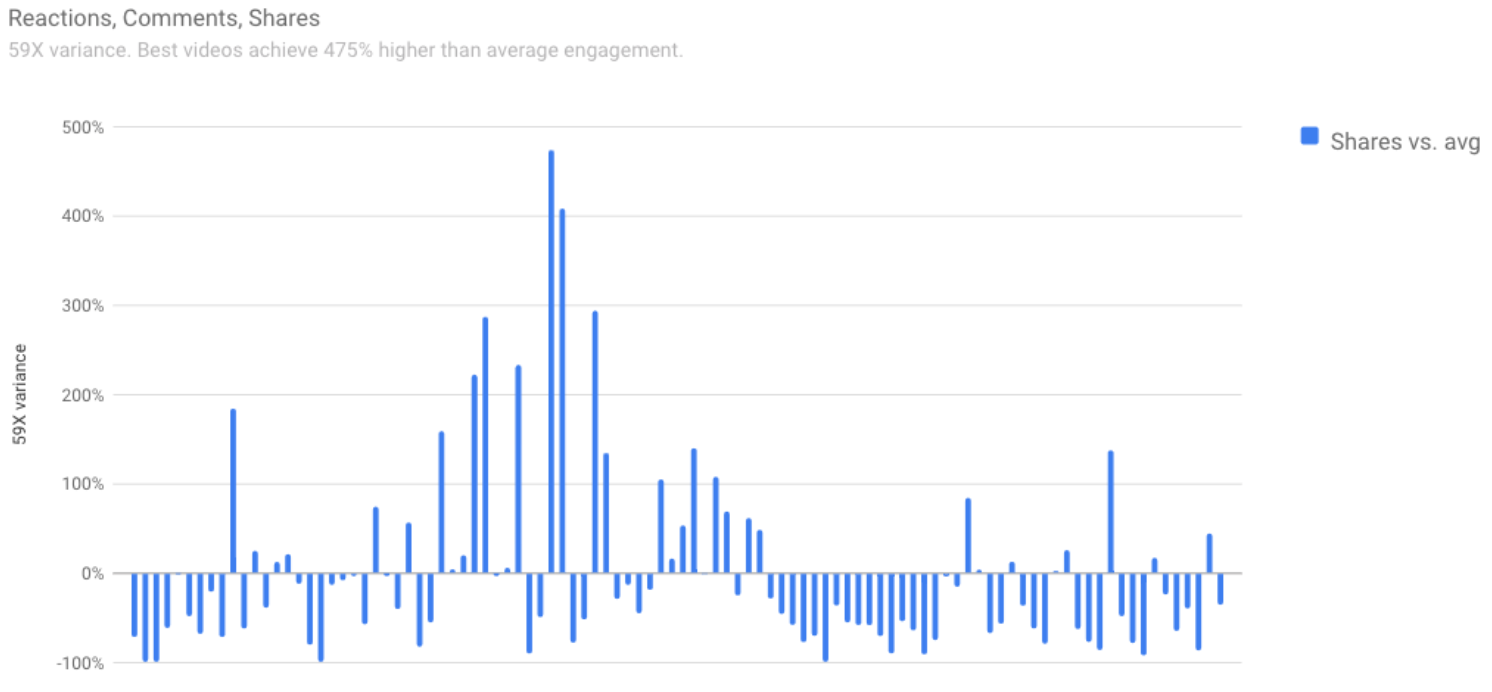
We found a massive 59x variation in engagement between the best videos and the worst videos, as measured by the ratio of shares to views.
The graph below shows the relative share-to-view ratio for each video.
The baseline is the average, so if the bar rises above the line, the video did better than average, or if it’s below the line the video did worse than average.

We believe that a significant factor in this variation is the video editing process – traditionally a creative, subjective process, vulnerable to personal bias and guesswork.
By adding AI and data science to the process, we believe that more predictable and better video marketing results become possible.
Discover how we replace guesswork with data science to make social video marketing more effective >>
Playable uses computer vision to watch every pixel of every frame, to identify the objects, events, faces, and sentiments of a video, and understand exactly what is going on:
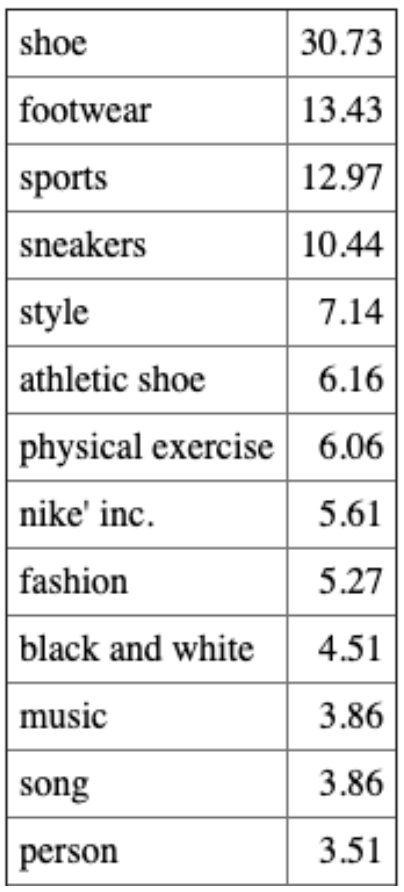
Creating a Predictive Model from Historical Training Data
The number shown is the relative importance of each characteristic. For this small sample of videos; shoes, sports, style (as in fashion/clothing) and exercise are most important for share-to-view ratio.
Playable uses this data to train its AI on what works best from your previous video campaigns, and then the AI automatically edits your next video campaign, relative to your campaign objectives, for optimal effectiveness.
Discover how Playable uses AI to drive social media video marketing effectiveness >>


